“Ephemeral P2P” project
On May 12, I posted to HackerNews a side project I’d been working on. The idea was that you can write down some content and then share that page, and subsequent visitors will load the page from your browser, and in turn share the page with future visitors still, and when the last person closes their browser tab, then the page is gone.
I called it “Ephemeral P2P” since it felt sort of like that, but it turns out that neither term was really correct.
Not really P2P
While the content does ultimately come from everyone’s browser, it does go through the server. Websockets won’t let you connect “laterally” to another browser. I received lots of suggestions to look into WebRTC which would allow it. And I heard from the author of instant.io which is a really nifty project that really does do in-browser P2P over WebRTC.
My project is sort of P2P in the sense that the system is capable of hosting more content than my server is capable of storing. And it wouldn’t be too difficult for others to deploy the code themselves and have the hosted pages shared across all the networks.
Not really ephemeral
The page I posted to HN almost 3 months ago is still up, with 34 peers. While I envisioned pages springing up and vanishing without a trace (and this did happen with little ones), people have taken the title of this page, “This page exists only if someone is looking at it”, as a challenge and have been trying to maintain it.
In fact, I’ve since learned that this content addressable web concept turns out to be the basis for other projects, e.g. IPFS, which have the opposite goal; namely, robust sharing of long-lived content.
Statistics and performance
The whole point of this side project was to test the Phoenix Framework of the Elixir language. Specifically, I was interested in its concurrency primitives called “channels”. Note: I deployed Phoenix 0.13, and the recently released 0.15 has performance improvements in this area.
I launched it on a free Heroku 1X dyno (512MB RAM). It held up very well for much of the day but I did have to switch to a 2X dyno (1GB RAM) at its peak. However, this was probably due in part to a bug in my implementation, which I’ll get to in the “Memory” section below.
I wrote a little Elixir app to process some of my log data and then displayed it with D3. You can find the code and data here. Unfortunately, I couldn’t embed the D3 in Medium here, so I just took a screenshot of it…
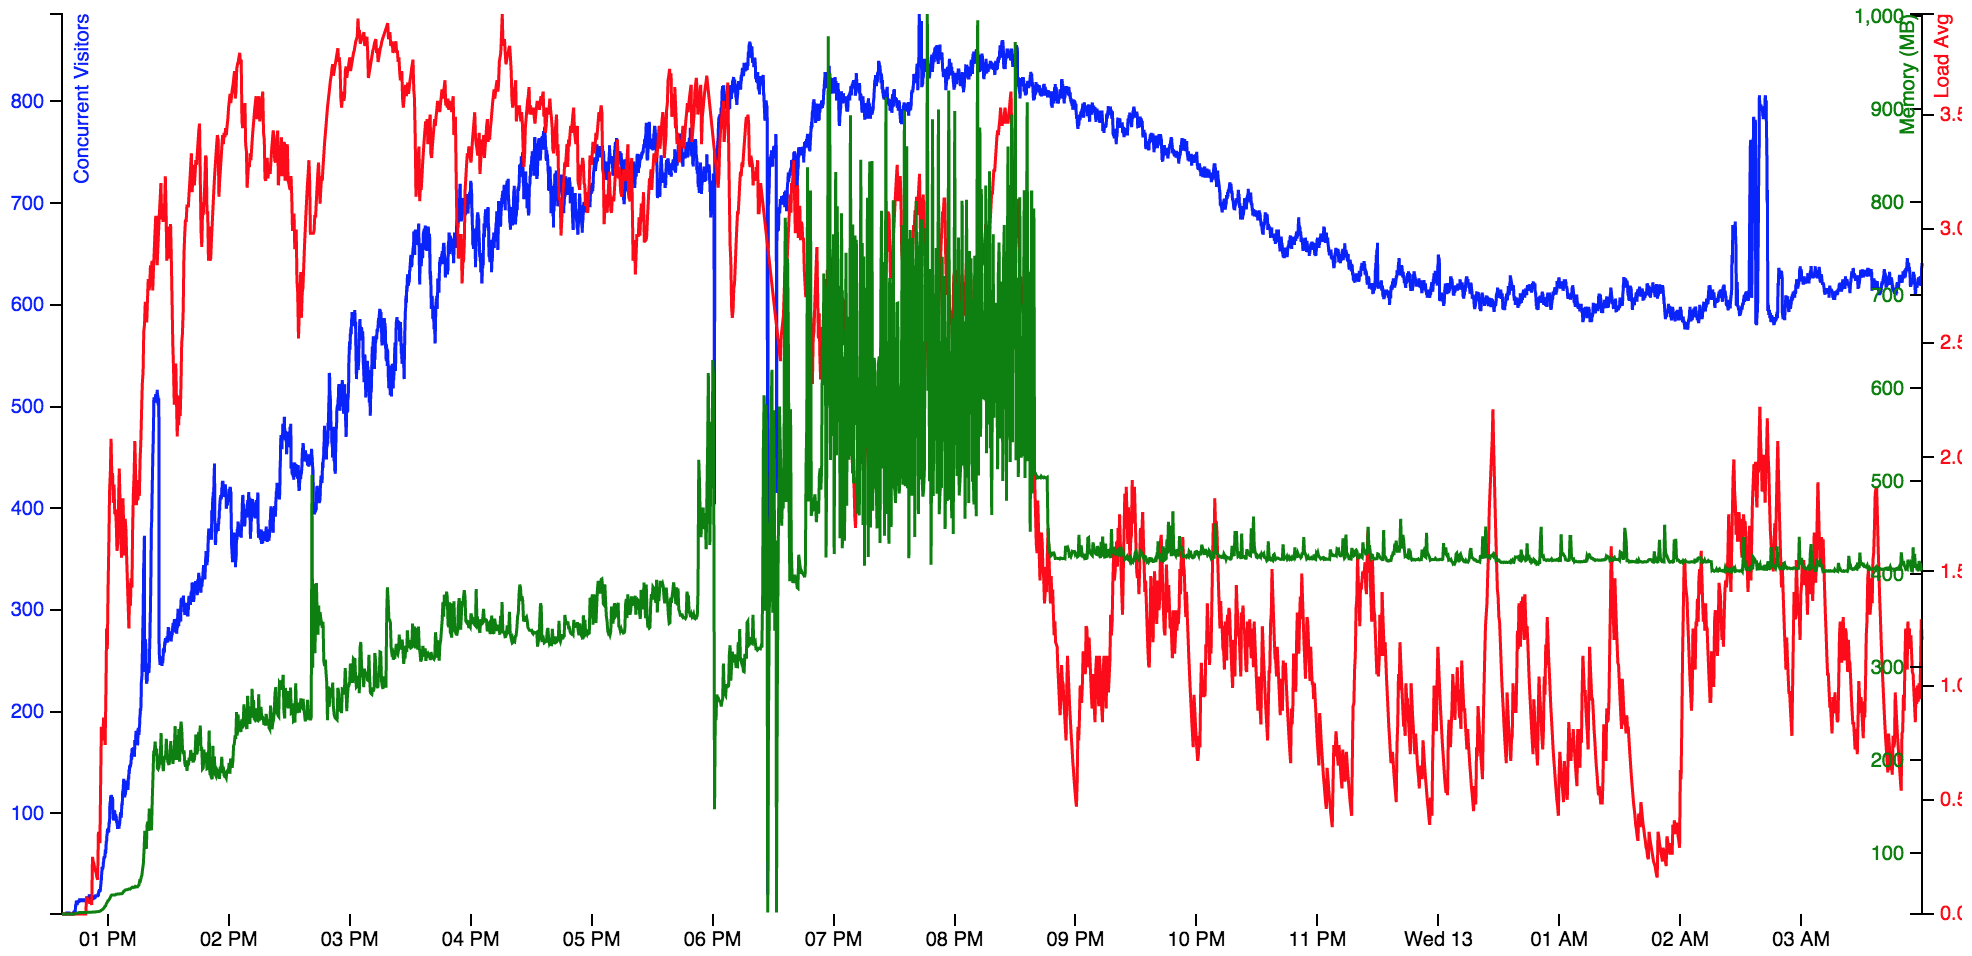
Concurrent visitors (blue), memory usage (green), and CPU (red) over the day I posted to HN. Time is UTC.
Visitors and concurrency
To test the concurrency, I designed it so that every visitor to the page would hold open a websocket connection to the server. I periodically logged the current number of websocket connections.
It hit the #1 spot of HN and remained on the front page for most of the day, eventually netting 38,000 browsing sessions according to Google Analytics. This is an underestimate given that many HN readers block GA. My server logs indicate 250k page loads during that time, but I can’t independently calculate “browsing sessions” from that.
At its peak, the project hit 880 concurrent websocket connections.
Memory
I used Heroku’s log-runtime-metrics tool to log the memory usage of the dyno every 20 seconds. The app used 34MB immediately after deploying to Heroku with no load. Memory usage increased linearly with concurrent visitors hitting about 300MB with 700 concurrent visitors. This implies approximately (300–34)/70 = 3.8MB / visitor, which seems awfully high. In Phoenix’s defense, I think this is actually at least double what it should be, since I essentially had every visitor join two separate channels: one for sharing the specific piece of content, and the other a global channel so I could have a count of visitors across the site.
Even though the memory usage was higher than anticipated, it was still enough to accommodate concurrent websocket connections from the front page of HN, with merely a Heroku 1X dyno.
That said, I did feel the need to bump to a 2X dyno when memory usage started going wild. I initially thought the reason was a “second wind” from HN or Reddit, but I later determined the craziness began at the same time as a comment was posted in the HN thread:
That’s nothing, this one has a base64 encoded video. http://ephemeralp2p.durazo.us/5264b0eea08fc0f6c8c164815c30ddc76259851838813a1e7a9a4050802d7e5b
This is what I referred to as a “bug in my implementation” earlier. Basically, all the shared content is passed around in an Erlang message, with no validation or limits. So I think when this person started sharing a base64-encoded video, that really messed with the BEAM virtual machine and memory usage on the dyno. As I understand it, Erlang doesn’t handle large messages very well.
Nevertheless, after I restarted the 2X dynos memory usage immediately leveled off and remained pretty constant. I think at this point the people sharing the base64-encoded video had given up and left.
CPU
Check the chart below. It fluctuated wildly and I didn’t really gain any insight into this. It seemed to max out very early in the day, but I didn’t see any negative effects from it. For now, CPU usage of Phoenix/Elixir is a question mark for me.
Response time
The Phoenix framework also logs page response times. I didn’t pay too close attention here since the page being loaded is essentially a static page. All the fetching of page content and whatnot occurs via the JS and hits the “channel” infrastructure, so doesn’t log 200 responses. But still, just for fun, here’s a random sampling of page loads around peak traffic time:
2015-05-12T18:29:12 app web.1 [info] Sent 200 in 274µs
2015-05-12T18:29:12 app web.1 [info] Sent 200 in 251µs
2015-05-12T18:29:12 app web.1 [info] Sent 200 in 296µs
2015-05-12T18:29:12 app web.1 [info] Sent 200 in 358µs
2015-05-12T18:29:12 app web.1 [info] Sent 200 in 264µs
2015-05-12T18:29:12 app web.1 [info] Sent 200 in 276µs
2015-05-12T18:29:12 app web.1 [info] Sent 200 in 3ms
2015-05-12T18:29:13 app web.1 [info] Sent 200 in 402µs
2015-05-12T18:29:13 app web.1 [info] Sent 200 in 533µs
2015-05-12T18:29:13 app web.1 [info] Sent 200 in 1ms
2015-05-12T18:29:14 app web.1 [info] Sent 200 in 202µs
2015-05-12T18:29:14 app web.1 [info] Sent 200 in 288µs
2015-05-12T18:29:14 app web.1 [info] Sent 200 in 185µs
2015-05-12T18:29:14 app web.1 [info] Sent 200 in 302µs
2015-05-12T18:29:17 app web.1 [info] Sent 200 in 963µs
2015-05-12T18:29:17 app web.1 [info] Sent 200 in 252µs
2015-05-12T18:29:17 app web.1 [info] Sent 200 in 241µs
2015-05-12T18:29:17 app web.1 [info] Sent 200 in 166µs
2015-05-12T18:29:17 app web.1 [info] Sent 200 in 216µs
2015-05-12T18:29:17 app web.1 [info] Sent 200 in 159µs
2015-05-12T18:29:17 app web.1 [info] Sent 200 in 217µs
2015-05-12T18:29:17 app web.1 [info] Sent 200 in 77ms
2015-05-12T18:29:17 app web.1 [info] Sent 200 in 60ms
2015-05-12T18:29:17 app web.1 [info] Sent 200 in 312µs
2015-05-12T18:29:17 app web.1 [info] Sent 200 in 305µs
2015-05-12T18:29:17 app web.1 [info] Sent 200 in 51ms
2015-05-12T18:29:17 app web.1 [info] Sent 200 in 161µs
2015-05-12T18:29:17 app web.1 [info] Sent 200 in 262µs
The vast majority of loads are under a millisecond, although a few bump up to tens of milliseconds for reasons I don’t understand. But all this is going on concurrently with the server managing all the websocket messages for passing around content. All in all I’m pretty impressed with it.
Other stuff
Amusingly enough, my project caught the attention of a journalist who interviewed me for an article on the Spanish news site ElDiario. That resulted in another couple thousand visitors.
And on July 20, someone posted it again to Reddit, and there was another explosion in traffic, this time with 150k browsing sessions. (4X the number from HN, but again, according to GA.) Unfortunately, I didn’t even realize this happened until looking at GA for this blog post, and by now most of my juicy logs are gone, so I can’t analyze how it held up.
Today, there are still more than 30 people holding the page open.
Concluding remarks
This project took off more than I dreamed of. As a test of Elixir and Phoenix it was a resounding success. I am wholeheartedly a believer in the two technologies going forward. Phoenix was just as easy to develop in as Rails (my day job), but with an order of magnitude better performance and extremely slick realtime concurrency support out of the box. The upcoming Rails 5 should have “ActionCable” but it simply won’t compare to Phoenix as a result of ruby’s limited concurrency support.
Moreover, the Elixir community is so welcoming and friendly, you can’t help but want it to grow. My interactions have been limited to the #elixir-lang freenode channel, but everyone on there has been great, with a particular shout-out to Chris McCord, lead developer of Phoenix, who helped me a number of times.
Unfortunately, as can be expected with any newly emerging technology, I will say that the ecosystem is not up to par with Ruby yet. In particular, I wanted to monitor the performance of my app, and there was nothing akin to NewRelic that I was able to find. I made do with lots of printing to the logs and post-processing, but until there’s a drop-in tool like NewRelic, I’m leery of using it in production. But I’m sure that over time this will change.
Mon, Aug 3, 2015 | For updates follow me on twitter